Matplotlib
2018.Jan.30
1. Introduction
- Matplotlib is a Python 2D plotting library.
- It produces publication quality figures in hardcopy formats and interactive environments across platforms.
- It can be used in Python scripts, the Python and IPython shell, the jupyter notebook, web application servers, and four graphical user interface toolkits.
- Users can generate plots, histograms, power spectra, bat charts, errorcharts, scatterplots, etc., with few lines of code.
> For simple plotting, the pyplot module provides a MATLAB-like interface, particularly when combined with _IPython
> For the power user, they can have full control of line styles, font properties, axes properties, etc, via an object oriented interface or via a set of functions familiar to MATLAB users.
2. Sample plots in Matplotlib
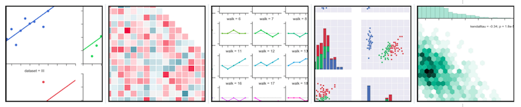
- Matplotlib has 24 sample plots.
Sample plots including: Line plot, Multiple subplots in one figure, Images, Contouring and pseudocolor, Histograms, Paths, Three-dimensional plotting, Streamplot, Ellipses, Bar charts, Pie charts, Tables, Scatter plots, GUI widgets, Filled curves, Date handling, Log plots, Polar plots, Legends, TeX-notation for text objects, Native TeX rendering, EEG GUI, XKCD-style sketch plots, Subplot example.
Sample plots
https://matplotlib.org/tutorials/introductory/sample_plots.html
3. Installation & Documentation
- 2.1.1 Latest stable version.
- 2.x Latest git master (unstable).
- Visit the Matplotlib installation instructions
- To get started, read the User's Guide
4. Toolkits
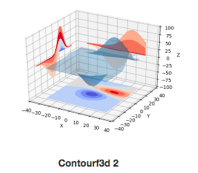
mplot3d
- mpl_toolkits.mplot3d provides some basic 3D plotting (scatter, surf, line, mesh) tools.
- Tutorial https://matplotlib.org/tutorials/toolkits/mplot3d.html#sphx-glr-tutorials-toolkits-mplot3d-py
- FAQ https://matplotlib.org/mpl_toolkits/mplot3d/faq.html
- API https://matplotlib.org/api/toolkits/mplot3d.html#toolkit-mplot3d-api
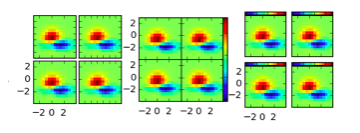
axes_grid1
- mpl_toolkits.axes_grid1 is a collection of helper classes for displaying multiple axes.
- Tutorial https://matplotlib.org/tutorials/toolkits/axes_grid.html#axes-grid1-users-guide-index
- FAQ https://matplotlib.org/mpl_toolkits/mplot3d/faq.html
- API https://matplotlib.org/api/toolkits/mplot3d.html#toolkit-mplot3d-api
axesartist
- mpl_toolkits.axesartist contains a custom Axes class to support curvilinear grids.
- To support curvilinear grid, the artists that are responsible for drawing axis lines, ticks, ticklabels, and axis labels are separated out from the mil’s Axis class.
- Tutorial https://matplotlib.org/tutorials/toolkits/axisartist.html#axisartist-users-guide-index
API
- Axes Grid and Axis API https://matplotlib.org/api/toolkits/axes_grid.html#axes-grid-api-index
5. Third Party Packages
External packages that extend or build on Matplotlib functionality are maintained and distributed separately from Matplotlib and thus need to be installed individually.
Third party packages including: several higher-level plotting interfaces - seaborn, holoviews, ggplot, and two projection and mapping toolkits - baseman and cartopy.
Mapping toolkits
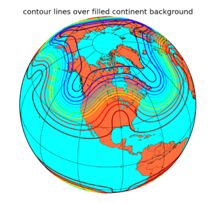
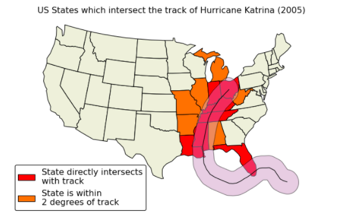
Basemap
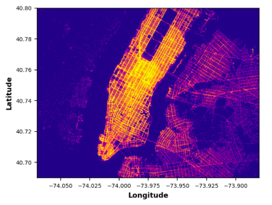
- Basemap plots data on map projections, with continental and political boundaries.
- Documentation https://matplotlib.org/basemap/
Cartopy
- Cartopy builds on top of Matplotlib to provide object oriented map projection definitions and close integration with Shapely for powerful yet easy-to-use vector data processing tools.
- Examples http://scitools.org.uk/cartopy/docs/latest/gallery.html
- Documentation http://scitools.org.uk/cartopy/docs/latest/
Declarative libraries
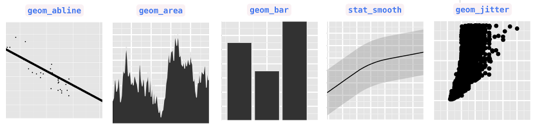
ggplot
- ggplot plots data on map projections, with continental and political boundaries.
- Documentation https://github.com/yhat/ggpy
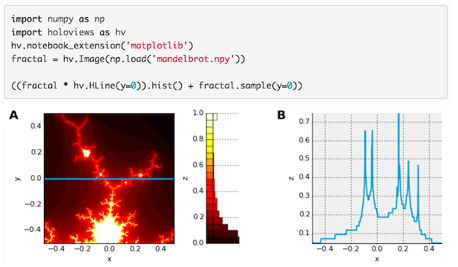
holoviews
- holoviews makes it easier to visualize data interactively, especially in a Jupyter notebook, by providing a set of declarative plotting objects that store your data and associated metadata.
- Official web http://holoviews.org/
Specialty plots
DeciDa
- DeCiDa is a library of functions and classes for electron device characterization, electronic circuit design and general data visualization and analysis.
- Documentation https://pypi.python.org/pypi/DeCiDa
Matplotlib-Venn
- Matplotlib-Venn provides a set of functions for plotting 2- and 3-set area-weighted (or unweighted) Venn diagrams.
- Documentation https://github.com/konstantint/matplotlib-venn
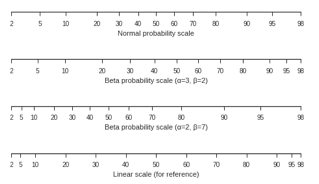
mpl-probscale
- mpl-probscale is a small extension that allows Matplotlib users to specify probabilty scales. Simply importing the probscale module registers the scale with Matplotlib, making it accessible via e.g., ax.set_xscale('prob') or plt.yscale('prob')
- Documentation http://matplotlib.org/mpl-probscale/
mpl-scatter-density
- mpl-scatter-density is a small package that makes it easy to make scatter plots of large numbers of points using a density map.
- When used in interactive mode, the density map is downsampled on-the-fly while panning/zooming in order to provide a smooth interactive experience.
- Documentation https://github.com/astrofrog/mpl-scatter-density
mplstereonet
- mplstereonet provides stereonets for plotting and analyzing orientation data.
Natgrid
- mpl_toolkits.natgrid is an interface to the natgrid C library for gridding irregularly spaced data.
pyUpSet
- pyUpSet is a static Python implementation of the UpSet suite by Lex et al. to explore complex intersections of sets and data frames.
seaborn
- seaborn is a high level interface for drawing statistical graphics with Matplotlib.
- It aims to make visualization a central part of exploring and understanding complex datasets.
Windrose
- Windrose is a Python Matplotlib, Numpy library to manage wind data, draw windroses (also known as polar rose plots), draw probability density functions and fit Weibull distributions.
Interactivity
mplcursors
- mplcursors provides interactive data cursors for Matplotlib.
MplDataCursor
- MpIDataCursor is a toolkit to provide interactive “data cursors” (clickable annotation boxes).
Miscellaneous
adjustText
- adjustText is a small library for automatically adjusting text position in Matplotlib plots to minimize overlaps between them, specified points and other objects.
iTerm2 terminal backend
- iTerm2 terminal backend is an external Matplotlib backend using the iTerm2 nightly build inline image display feature.

6. Additional Resources
Videos
- Plotting with matplotlib by Mike Müller
- Introduction to NumPy and Matplotlib by Eric Jones
- Anatomy of Matplotlib by Benjamin Root
- Data Visualization Basics with Python (O’Reilly) by Randal S. Olson
Tutorials
- Matplotlib tutorial by Nicolas P. Rougier
- Anatomy of Matplotlib - IPython Notebooks by Benjamin Root
Assist
- You can check FAQ, the API docs, and mailing list archives for resources.
- Join the gitter and the mailing lists: Users, Announce and Devel.
- Check out the Matplotlib questions on stackoverflow.
- To keep up with the latest information, check the “what’s new page”, “source code” and “api changes file"
- Matplotlib is hosted on Github, Issues and Pull requests are tracked at Github too.
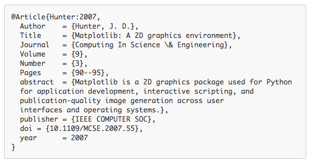
Citing Matplotlib
- If Matplotlib contributes to a project that leads to a scientific publication, please acknowledge this fact by citing Hunter et al (2007) using this ready-made BibTex entry: